Financial Reporting RPD Using OBIEE
Building repository using multidimensional data source for financial analysis.
(Here multidimensional data source is Hyperion Essbase)
(Here multidimensional data source is Hyperion Essbase)
1. Start the multidimensional data source. Check out the Application Name, database name and its Outline of the cube first in Essbase Administration Services which you want to use for building repository.

(OBDATA is an Application name, CCoA (Common Chart of Accounts) is database. Also remember the login credentials of the application.)
2. Measures which are used in reports.


3. Now open the Administration Tool-> go to file menu select new to create an empty repository -> give a name to save rpd.
4. Go to File menu -> Select import -> from Multidimensional. (A new window will open)
4. Go to File menu -> Select import -> from Multidimensional. (A new window will open)

5. A Import from Multidimensional window will display select Essbase as provider type from drop down list give server name, Username and password than press “OK”.

After selecting “OK”, a list of applications and cubes available on the Essbase Server is displayed.
6. The Administrator than has the option of selecting either Essbase applications or cubes to import.

7. Verify the Import in Physical Layer:-
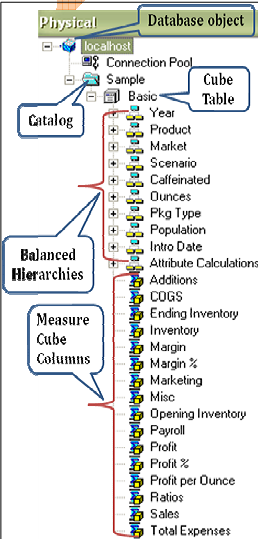
When you import the physical schema, Oracle BI Server imports the cube, including its metrics, hierarchies and levels. Each multidimensional catalog in the database can contain multiple physical cubes. You can import one or more of these cubes into your BI repository. You can create a cube table manually. However, it is recommended that you import cube tables and their components. (Note that Essbase applications are mapped as Physical catalogs.)
7.1). Each cube from a multidimensional data source is set up as a physical cube table, a type of physical table. It has all the capabilities of a table such as physical cube columns, keys (optional) and foreign keys (optional). It also has cube-specific metadata such as hierarchies and levels. In the Physical layer, a physical cube table looks like a regular table but has a different icon. Columns also have unique cube icons:-
- Key icons represent attributes that are part of the hierarchy.
- Columns with cube icons represent attributes that are not part of the hierarchy.
- Columns with cube icons plus the sigma sign represent either additive measure or calculated members.
(*#* The physical model is option is hidden for the multidimensional cube so you cannot create or see the physical model of cube)
7.2) Verify Imported Hierarchies and Levels
In the Physical Cube Table dialog box, the Hierarchies tab lists the dimensional hierarchies in the cube. In this dialog box you can add, edit or remove hierarchies.
In the Physical Cube Table dialog box, the Hierarchies tab lists the dimensional hierarchies in the cube. In this dialog box you can add, edit or remove hierarchies.
To verify a hierarchy, select it and click Edit, or double-click the hierarchy. In the Hierarchy dialog box, verify that the levels are correct. The Hierarchy dialog box lists all the defined levels for the selected hierarchy.
The highest level in the hierarchy should be the first (highest) item in the list. If you need to reorder the hierarchy levels, select a level and click Up or Down to correct the order of the levels. There must be multiple
levels and you must select a level for the buttons to be available.
levels and you must select a level for the buttons to be available.
You can also reorder, add, edit or remove levels. Note the multidimensional level icon .This confirms that these columns have been identified as part of the hierarchy. The “Default Member type ALL” check box should always be selected by default. This is for performance reasons. This check box helps Oracle BI Server rewrite more efficient Multidimensional Expressions (MDX) when sending logical queries.
If you delete property or key columns from a level, the association is deleted and the column changes to a measure under the parent cube table.

7.3) Verify Imported Measures
To verify and assign the aggregation rule correctly follow the below instructions:-
To verify and assign the aggregation rule correctly follow the below instructions:-
- Verify aggregation rules after importing a cube. Typically, aggregation rules are assigned correctlywhen you import the cube. However, if a measure is a calculated measure, the aggregation rule isreported as None. Therefore, you should examine the aggregation rule for all measures afterimporting a cube to verify that the aggregation rule has been assigned correctly.
- For all measures assigned an aggregation rule value of None, contact the multidimensional datasource administrator to verify that the value of the aggregation rule is accurate. If you need to change the aggregation rule, you can change it in the Physical Cube Column dialog box. If you build the measures manually, set the aggregation rule to match its definition in the multidimensional data source.
For all the measures the aggregations rule is Aggregated External by default showing in the physical layer.
(For this cube you don’t need to change anything for measure columns in physical layer.)
(For this cube you don’t need to change anything for measure columns in physical layer.)
*#*Note: - The measures hierarchy is not supported in OBIEE (10.1.3.4.1) so it get flattened after importing into physical layer.
8). Create the Business Model and Mapping Layer.
Import the physical cube into the Business modeling and mapping layer, drag and drop the cube into the Business Model and Mapping Layer to automatically create a Business Model that includes associated dimensions and hierarchies.
When you drag from the Physical layer, logical tables, dimensions and relationships are created automatically. The Business Model can then be customized to take advantage of BI Server capabilities such as aggregate and fragment navigation.
8.1) Right click on the newly imported cube in the BMM layer and navigate to Business Model Diagram -> Whole Diagram. You can see automatically created model (Star schema because of multidimensional cube).
It is possible to create it on your own.

Arrange the model.
8.2) Expand the Year dimension, verify all the columns and Year hierarchy verify all the levels are in correct flow or not.

8.3) You can see that year hierarchy is not in correct form so correct it as shown in below screen shot. Just go to year dimension and rename the Quarter column as Year, Months column as Quarter and Gen4,Year column as Months and also change the names of levels also.

8.4) Also rename the columns of caffeinated and Pkg type.
(Rename other tables and columns as per your requirement and understanding.)
(Rename other tables and columns as per your requirement and understanding.)

8.5) Now change the aggregation rule for all the measures from Aggr_External to Sum to create new computed logical columns and to apply functions.

8.6) Create a new logical column Rank_Sales (Rank) using any existing logical column.
Right click on the fact table CCoA and select New object -> Logical Column.

Give a name Rank_Sales for the column and select the check box Use existing logical column as the source -> click on eclipse select logical tables-> CCoA(Fact table)-> Logical Column (Sales) and click on Insert then ok.

Put the existing logical column into bracket and add Rank as shown in the above screen shot and press ok to save this column. (You can see the newly created logical column).
9). Create the Presentation Layer
Setting up the Presentation layer for multidimensional data sources is similar to setting up the Presentation layer for a relational data source. To create the Presentation layer, you can drag the business model into the Presentation layer. You can than modify objects in the Presentation layer just as you would with a relational data source as per your understanding and requirements.
9.1) Right Click in the empty presentation layer and select-> New presentation catalog to create a new presentation catalog, give a name Ad-Hoc Analysis and press ok to save it.
9.2) Drag tables and columns into the catalog for Ad-hoc Analysis.
9.3) Now again create a new Testing Team catalog and put all the tables inside it, make it complete with all the available tables and columns.

10) Create Groups and group members.
10.1) Go to Manage in Admin Tool-> Select Security.
Select Groups from left pane in security manager then right click into right pane and select New Security Group.

10.2) Enter a name for the new group and grant permissions.
(Permission is depends on the requirements of users what tables and columns they require for reporting)

Create groups as per your requirement.

10.3) Create new Users
Similarly select users from left pane and then right click into right pane select New User.

Enter a user name, set logging level and select groups to which group this user belongs. Permissions which are granted to the group are automatically applicable for the user also.
If you do not set permissions for users the group permissions were applicable for user.
11).Testing and validating repository.
11.1) After building the presentation layer test the repository Check Global Consistency for errors and save the repository.

Now the repository is ready and available for query.
11.2) Now configure the name of repository into OraclceBI/Server/Config NQSConfig.ini file and save the changes.
11.3) Start the services one by one
A) Oracle BI Server
B) Oracle BI Presentation Server
C) Oracle BI Java Host
11.4) Go to Start menu,
All Programs-> Oracle Business Intelligence ->Presentation Services.
Enter Login credentials as repository y.
Enter Login credentials as repository y.

11.5) Click on the answers link.
Select a catalog from subject Area.

11.6) Select columns from left pane.

Click on the Results tab to get the result.

11.7) Check the Query Log to Verify Queries.
At the top right portion of the page, click Settings -> Administration to open the Oracle BI Presentation Services Administration Window. Click the Manage Sessions link to open the Session Management Window.

Click the View Log link for the last entry.

Locate the SQL Request section. This section contains the logical SQL issued from Answers.
Locate the General Query Info section. This section identifies the repository, subject area, and presentation catalog from which the query was run.
The rest of the file contains information such as query status, number of rows returned, the physical data source to which Oracle BI Server is connecting and the physical SQL that was generated and so forth.
12). This repository is tested and validated successfully and now ready to build reports.
To build report and Dashboard Based on this Repository visit Financial Reporting Using OBIEE page.

No comments:
Post a Comment